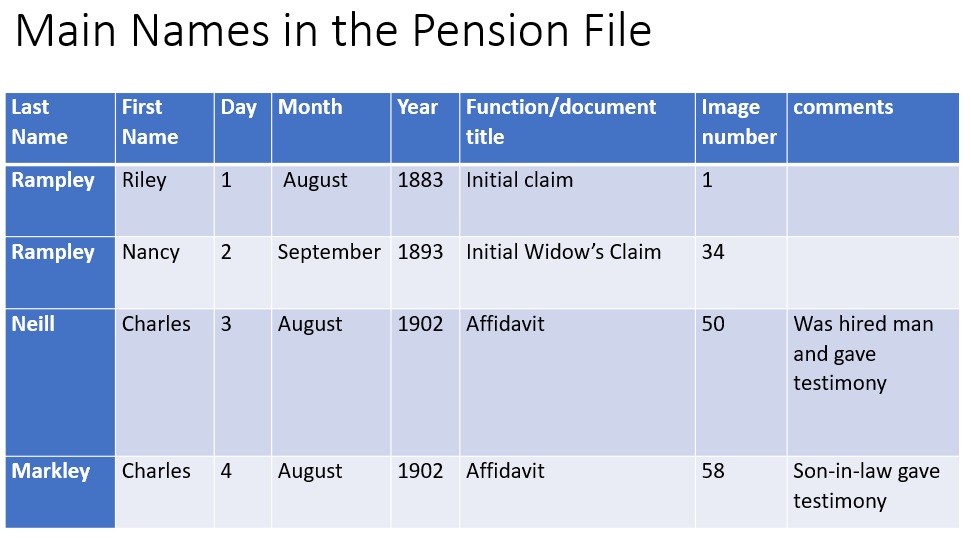
Organizing information can be one of the most difficult parts of the genealogical research process. It is also one of the most important. This session is not about organizing the documents, files, and images you have. It is about organizing the pieces of information those materials contain.
It will be about organizing data in a variety of ways to help you notice trends, patterns, hidden clues, and errors in your own research. We will see how to create charts and forms for your own research use to effectively organize genealogical information–names, dates, and locations. Charts and tables will be ones that can easily be created in any word processor or spreadsheet. Images will be created using inexpensive or free graphics software. Our goal is not to teach you software but to help you see ways to organize information for yourself and the others with whom you share it.
We will also discuss using color and other visual enhancements as well to help sort and organize.
This session was already held, but a recording and a copy of the handout can be purchased for immediate download.
