 Sometimes it’s good to be exceptional and sometimes it’s good to be average. Exceptional scores are great for academics and athletic competition. For medical tests it’s best to be average.
That’s true for DNA as well.
When looking at the amount of shared DNA you have with a known relative, it’s good to be average–or at least within the expected range of shared DNA for the relationship. Unusual values can be cause for concern.
One way to see if your shared DNA is unusual for a given relationship is to use the data summaries from the “Shared CM Project.” Blaine Bettinger’s “Shared CM Project” encourages DNA genealogists to submit the amount of shared DNA they have with known relatives so that average amounts of shared DNA for certain relationships can be obtained. The most recent update included 25,000 submitted relationships. That’s a fairly large set of data and was used to determine average amount of shared DNA based upon relationship. Average amounts of shared DNA and ranges of shared DNA were calculated based upon those submissions. The last three columns of this spreadsheet are from the “Shared CM Project.”
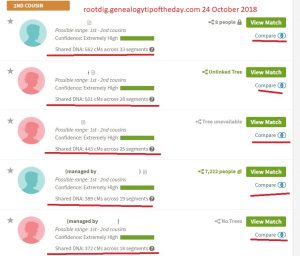
I was curious if my “closer” relatives who had submitted DNA for autosomal testing at AncestryDNA were close to the averages. Data that is significantly different from the expected values is suggestive of more research. A conclusion cannot be reached about one person when all I know is that one person’s shared centimorgans (cM) of DNA is “significantly” different from the expected value.
The relationships as given in this chart were obtained via traditional genealogical methods (ie. not using DNA). The names as used in this chart have been “altered” for privacy and in an attempt to be clever–the only connection to the individual is alliterative. For the most part, these people were people I either knew or was aware of before I ever knew they had done a DNA test.
| shared cM data | shared cM data | shared cM data | |||
| name | relation | cM | average | low | high |
| Mush | 1c1r | 562 | 439 | 141 | 851 |
| Mash | 1c1r | 501 | 439 | 141 | 851 |
| Mash2 | 1c1r | 443 | 439 | 141 | 851 |
| Lariat | 1c1r | 389 | 439 | 141 | 851 |
| Partake | 1c1r | 372 | 439 | 141 | 851 |
| Geode | 2c | 229 | 233 | 46 | 515 |
| Tjode | 2c | 163 | 233 | 46 | 515 |
| Lisa | 2c | 119 | 233 | 46 | 515 |
| Road | 3c | 92 | 74 | 0 | 217 |
| Chuckie | 3c1r | 105 | 48 | 0 | 173 |
| Byebye | 2c1r | 70 | 123 | 0 | 316 |
| Lint | 3c | 68 | 74 | 0 | 217 |
Abbreviations:
- 1c1r-first cousin, once removed–these individuals are all first cousins of my parents
- 2c-second cousin–these individuals share a set of common great-grandparents with me
- 2c1r-second cousin, once removed–this individual’s mother and my grandmother were first cousins
- 3c–third cousin–this individual and I share a set of common great-great-grandparents
- 3c1r–third cousin, once removed
Averages are only averages. Researchers should potentially be concerned if the shared DNA falls outside the range of shared cM values for a given paper relationship. In other words, a first cousin once removed who has less than 141 cM of shared DNA or more than 851 cM of shared DNA would be unusual.
Unusual, not impossible. Further work would need to be done.


One response
From Williamcrimi withlove))