 Visuals can add to a presentation in ways that words simply cannot.
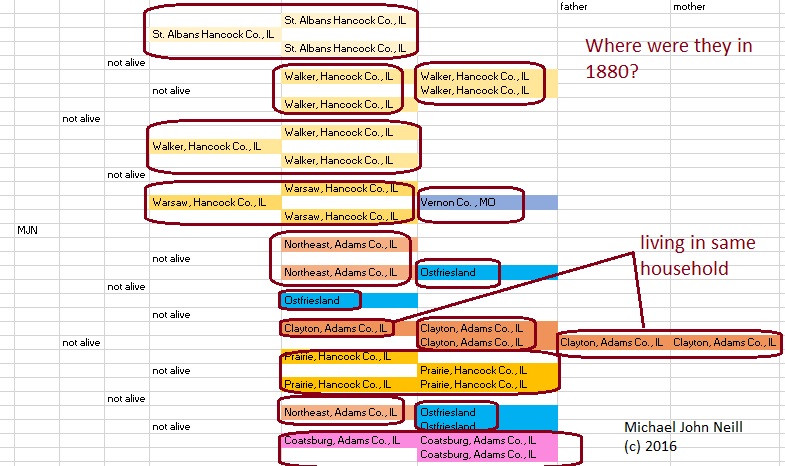
The image that is a part of this blog post is a modified six-generation pedigree chart. Instead of listing names of individuals, their residence in 1880 is given. Since so many of my families were in one of two Illinois counties, I chose to color code as specifically as the township.
The “circles” represent individual households in that census, or in the cases of those who were not enumerated in the census, couples who were most likely living together. There is something a little bit unusual about the family grouping in Prairie Township.
I had to do a little bit of thinking to create the chart.

5 Responses
I like this idea. I could see some applications in my own trees. Thanks for writing about it.
Some of my ancestors ended up in Hamilton County, Illinois. There is also a Prairie township there.
A fantastic idea! I have a few people that this might work with. Thanks for sharing.
This is a great grouping visualization for working on some prairie families that I started tonight after I saw this post. Thanks.
You’re welcome! I’m glad you found it helpful.