Charts are very popular genealogical research tools–even when you don’t find what you are looking for. It is organizing the search that is helpful.
The problem was that I was having difficulty finding Peter Bieger and his wife Barbara in the 1850 census. In order to search for him effectively, I used several different websites that index the 1850 census. However, looking at the same entry over and over got a little tedious and was a waste of time.

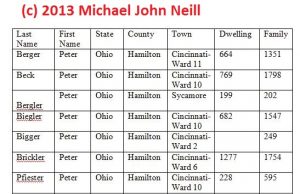
To keep track, I started with a simple chart summarizing the location of each entry. I didn’t include links to the specific website’s image. What I was concerned about was the dwelling and the family number (along with the State, County, and Town/City) as that would be on the census page regardless of what website I was using.
I could easily add columns for this chart–the best one to add would be a comments column for “why” I rejected this person as being the Peter Bieger of interest. If you do not track why a certain person was rejected, it is difficult to go back and analyze again if assumptions change about the person of interest.
I still have not found Peter in 1850, but the chart at least helps me track what I have done.
Another approach would be to search for Barbara Bieger as well. It could be that the first name of Peter is spelled so incorrectly that I’m not locating it.
Or Peter may have been enumerated with his middle name instead of his first name. Since I don’t know his middle name it makes it difficult to search for him using it.

3 Responses
What is the family number??
Often there were more than one family in a dwelling.
Maybe. The more rural the area the less likely this is to happen, but it’s always worth considering. In this case I am just using the numbers to help track what entry I have already seen.